
One of my professional development goals for last year was completing ISTE’s course called Computational Thinking For Every Educator. I have always been interested in seeing the integration of Computational Thinking (CT) as a problem solving and critical thinking tool across the K-12 spectrum. One of the big initiatives in this direction earlier this year was the launching of CT Pod – a teacher run podcast at ISA – that takes a closer look at the different ways in which CT can find a place in any classroom. Almost as a complimentary piece to that, I completed the summer offering of ISTE’s course recently. This post is a summary of my big takeaways from this experience.
Clarifying CT’s association with CS
Not surprisingly, one of the first things the course addresses is how CT is and is not related to Computer Science. I thought this was a sensible start since the word computational invariably makes it seem that CT is computing/programming specific which can often be the biggest deterrent for non-computing teachers to get involved with it. The course establishes a strong case that CT’s components – decomposition, pattern recognition, abstraction and algorithms – are like pieces of any puzzle (in any subject, with any topic) that are independent of any specific discipline. To further cement this point each section that deals with one aspect of CT is intentionally designed to connect with a non-computing/non-CS subject area. You can read/download ISTE’s CT competencies document here.
Making CT visual for a wider buy in
In my developing understanding of CT’s role across the spectrum, making the keywords, terminology, steps, approaches etc. visual and easy to digest seems like step one. Some examples can be found here, here, here and here. The course offered some good infographic examples (which I cannot share unfortunately due to copyright) which I feel has to be the next step for any educator currently implementing CT into their subject areas. Platforms like Canva offer simple drag and drop tools which can help you create specific and pointed visual representations of CT’s wider role in the languages, math, science, music and even physical education.
The four stages linked by a single artifact
Each of the four stages – decomposition, pattern recognition, abstraction and algorithms – then dived deep into different subject and age ranges. From examples of Math for 5-8 year olds to Science for 6-12 year olds to Music for 13-18 year olds … each module was full of detailed breakdowns of how each of these stages could play out. One small example is: How is conflict depicted throughout 20th century art? Such a leading question can be decomposed further by events, samples of conflict, symbols or other iconography that may have been used etc. That then could go further into comparing recurring patterns and motifs. Another example could be considering a general melody within a specific genre of music. This involves investigating instruments, artists, samples of genre etc further leading to comparing artists, chord progressions. Some variant of such an approach to problem solving has existed within all subject areas. CT, in my opinion, gives it a structure and leads to a step based recipe which is the definitive solution finding map for students.
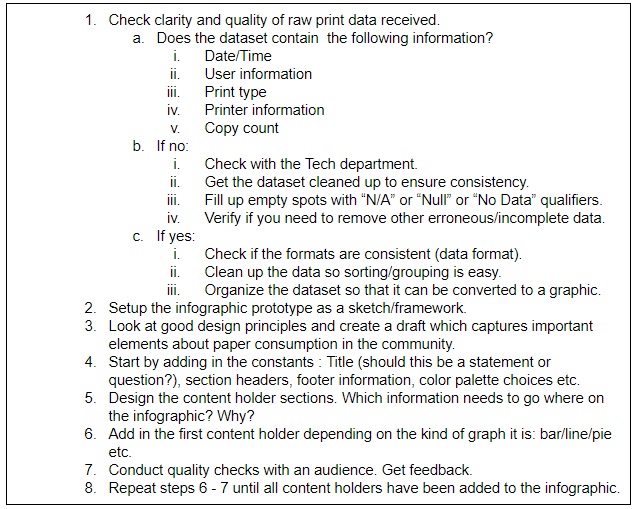
The course required us to submit an artifact of our own for each of the stages. I chose to work with an infographic project I have done in past investigating paper consumption in a high school. Even though I had not explicitly taught these stages with my group I took this opportunity to identify each of the stages within that project. Here is the summary of how these stages can find a place within such a problem.

For the final algorithm stage, I created a step-by-step recipe which was aimed at helping the students create the final product.
Resources!
There always needs to be a strong repository of resources that allows teachers of all subjects to try and embed elements of CT within their lessons. This course gave me some fascinating resources which, combined with my own collection, I have started curating within this interactive data studio table. This is very much a work in progress so if you wish to add to this bank, please feel free to reach out.
