The process
As a teacher a primary focus point is always student scores on all sorts of assessments. Whenever I handed back papers for unit tests or exams or mid terms I would always create a Google sheet with the following data.
- Student Name
- Question Number
- Maximum points for that question
- Student score
This granular approach to dissecting the numbers often highlighted issues that went beyond a specific concept or unit. Specially in multi-part questions it was always interesting to see how a student got the first part partially correct but the second one completely right! Over several years of using this approach I found it immensely useful to isolate issues and create appropriate tiered and/or differentiated activities to support kids get a better handle on the concept the question was trying to address.
So, the layout of the sheet I have used is pretty simple. The image below shows a template for it (the names are fake) where a unit test is shown. It is for 50 points and there were 12 questions in total (10 and 11 being multi-part). This is a typical IB paper approach that I have used.

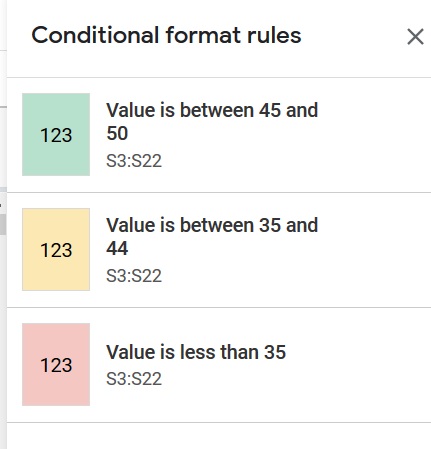
The color coded column for the total points each kid got is based on the following ranges.
The Student Perspective
Column T is a rather interesting one. It contains a list of questions where the kid scored 50% or less than the max score. To generate it I wrote a formula in T3 that looks like this and dragged it for all the cells in T. It automatically updates it for the relevant row.

The FILTER( ) pulls out Question numbers (B1 to R1) for all cells in that row whose value is <=50% of the max score(B2 to R2). This obviously changes every time since not all tests will have the same structure of questions. But the idea is that we quickly get an estimate about the student’s performance by seeing which questions he/she scored low on.
This formula, hence results in this column.

The Class Perspective
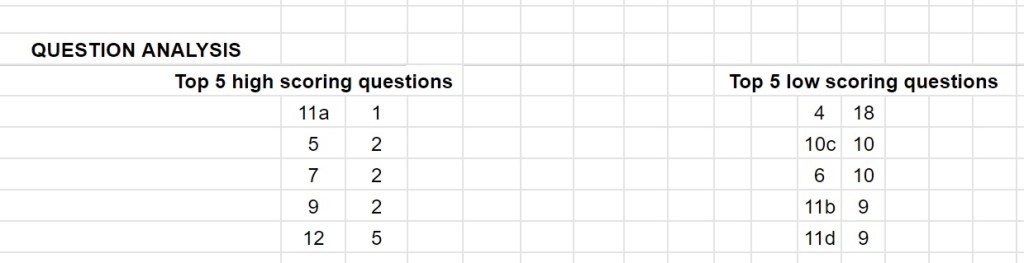
This is good data for me since I can look up specific information for each student. But how did the class do overall? Which questions were better answered and which ones were not? For this, a slightly complex formula is used that creates the data below.
Using the column data for T this list returns a count of how many questions appear there. Ideally that entry should be BLANK for every student – meaning that all kids managed to get >50% of max score on each question!
The formula which accomplishes this is the following. Since it has to pull out data from a column that has multiple values in each row, it first splits them up based on comma, then transposes them into a single list (one below the other) and queries them to print the top 3 or 5 or whichever number you wish.
=ArrayFormula(query(transpose(split(TEXTJOIN(",", 1, T3:T22),",")&""), "Select Col1, count(Col1) where Col1 <>'' group by Col1 order by count(Col1) asc limit 5 label count(Col1)''")) If I change the asc (short for ascending) in the code to desc then I get the questions that were badly answered. The limit for this example is top 5 but you can choose to alter that.
This data now tells me that Question 4 was the worst answered with 18 out of my 20 kids getting <=2 for a 4 point question. In second place was 10c which was a multi part question. So why did kids get 10a and 10b mostly correct and not 10c? Things like these are indicative of bigger issues that go beyond that specific question. A few immediate questions would be : What did they get wrong? How did they misinterpret it? Is there a conceptual lack of understanding there or was it the language used to describe it? Was it an algorithm that wasn’t attempted properly? Lot of potential issues get identified that will be revisited and reviewed once again with the class.
Bottom line
Going over every question on the paper and discussing it is standard procedure. But this sort of drill down has allowed me to go deeper into specific areas of concern for each of my students. I have used such indicators as ways to modify instruction for future lessons so that students can get more opportunities to both attempt and excel at the concepts they had initially struggled with. This process has also helped in teaching me what is important for the class so that we can all take a step back and adjust our lesson.
